Semantic Analysis
Cluster concordance lines by semantic similarity
Overview
Semantic analysis groups concordance lines into clusters based on sentence embeddings. It helps you discover semantic patterns and sub-senses within a query.
When to use it
- Explore semantic neighborhoods of a lemma or construction
- Identify sense clusters or topical groupings
- Compare usage across genres or time ranges (via filters)
How to run
- Run a CQL query in the custom app.
- Open the Semantic analysis panel.
- Choose sample size and method (UMAP or t-SNE).
- Click Analyze and wait for results.
Controls
- Sample size: number of concordance lines to embed.
- Method: UMAP or t-SNE dimensionality reduction.
- Clusters: automatic; you can adjust the number of clusters after analysis.
Output
- Scatter plot of points (each point = one concordance line).
- Cluster stats (cluster size, silhouette score).
- A concordance table you can filter by cluster selection.
Interpreting Cluster Quality
The Silhouette score measures how well-separated clusters are:
| Score Range | Interpretation |
|---|---|
| 0.7 - 1.0 | Strong structure — clear, distinct clusters |
| 0.5 - 0.7 | Reasonable structure — clusters mostly separable |
| 0.25 - 0.5 | Weak structure — overlapping clusters, but patterns visible |
| < 0.25 | No structure — clustering may not be meaningful |
Example: Slovak strana (“side” or “party”) with Silhouette 0.409 shows two distinct meaning clusters:
- Cluster 1: Spatial/perspective sense — z tretej strany (“from the third side”)
- Cluster 2: Political sense — opozičná strana (“opposition party”)
A score of 0.409 indicates moderate separation — the senses are distinguishable but have some contextual overlap.
Notes & tips
- Larger samples give richer structure but take longer.
- Clusters are exploratory, not gold-standard categories.
- If
OPENAI_API_KEYis set on the server, the app uses OpenAI embeddings; otherwise it falls back to a local embedding model.
Example: Analyzing “partnership” in UniPlans
This walkthrough demonstrates semantic analysis using the UniPlans corpus of UK university strategic plans.
Step 1: Set up the query
- Select UniPlans (383K tokens) from the corpus dropdown.
- In the query builder, set:
- Attribute:
lemma - Operator:
== - Value:
partnership
- Attribute:
- Click Run builder query.
The query returns roughly 900 matches for forms of “partnership” across university strategic plans.
Step 2: Configure and run analysis
- Scroll to the Semantic analysis panel.
- Select sample size (e.g., 200 hits for a manageable analysis).
- Choose visualization method (t-SNE or UMAP).
- Click Analyze.
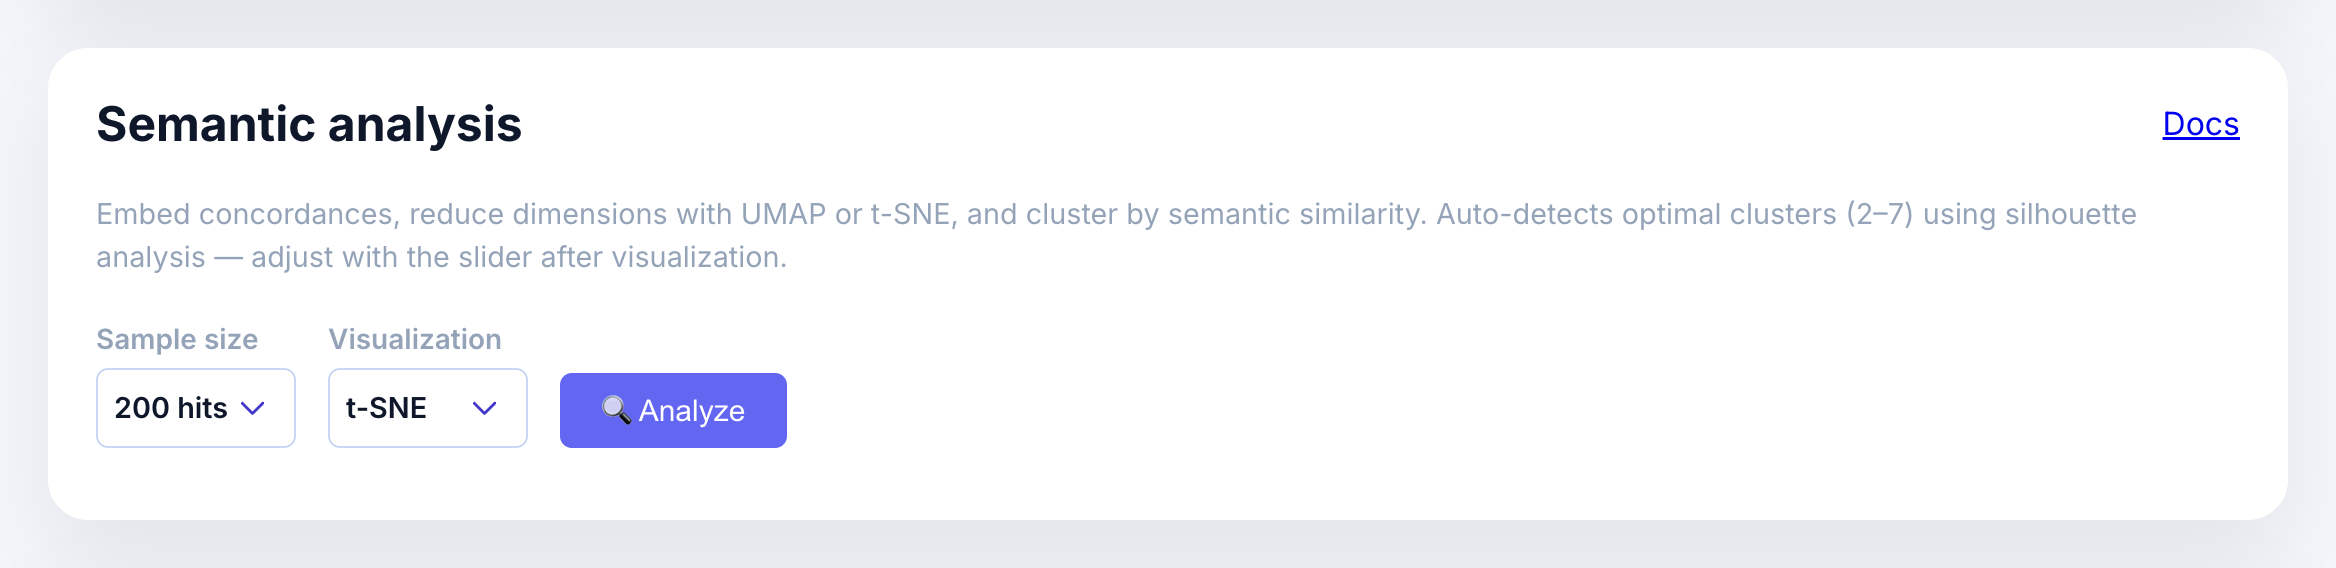
The analysis embeds each concordance line, reduces dimensions, and clusters automatically.
Step 3: Interpret the scatter plot
After analysis completes, you’ll see:
- A scatter plot where each point represents one concordance line
- Points colored by cluster assignment
- Cluster buttons showing the size of each cluster
- Silhouette score indicating cluster quality (higher = better separation)
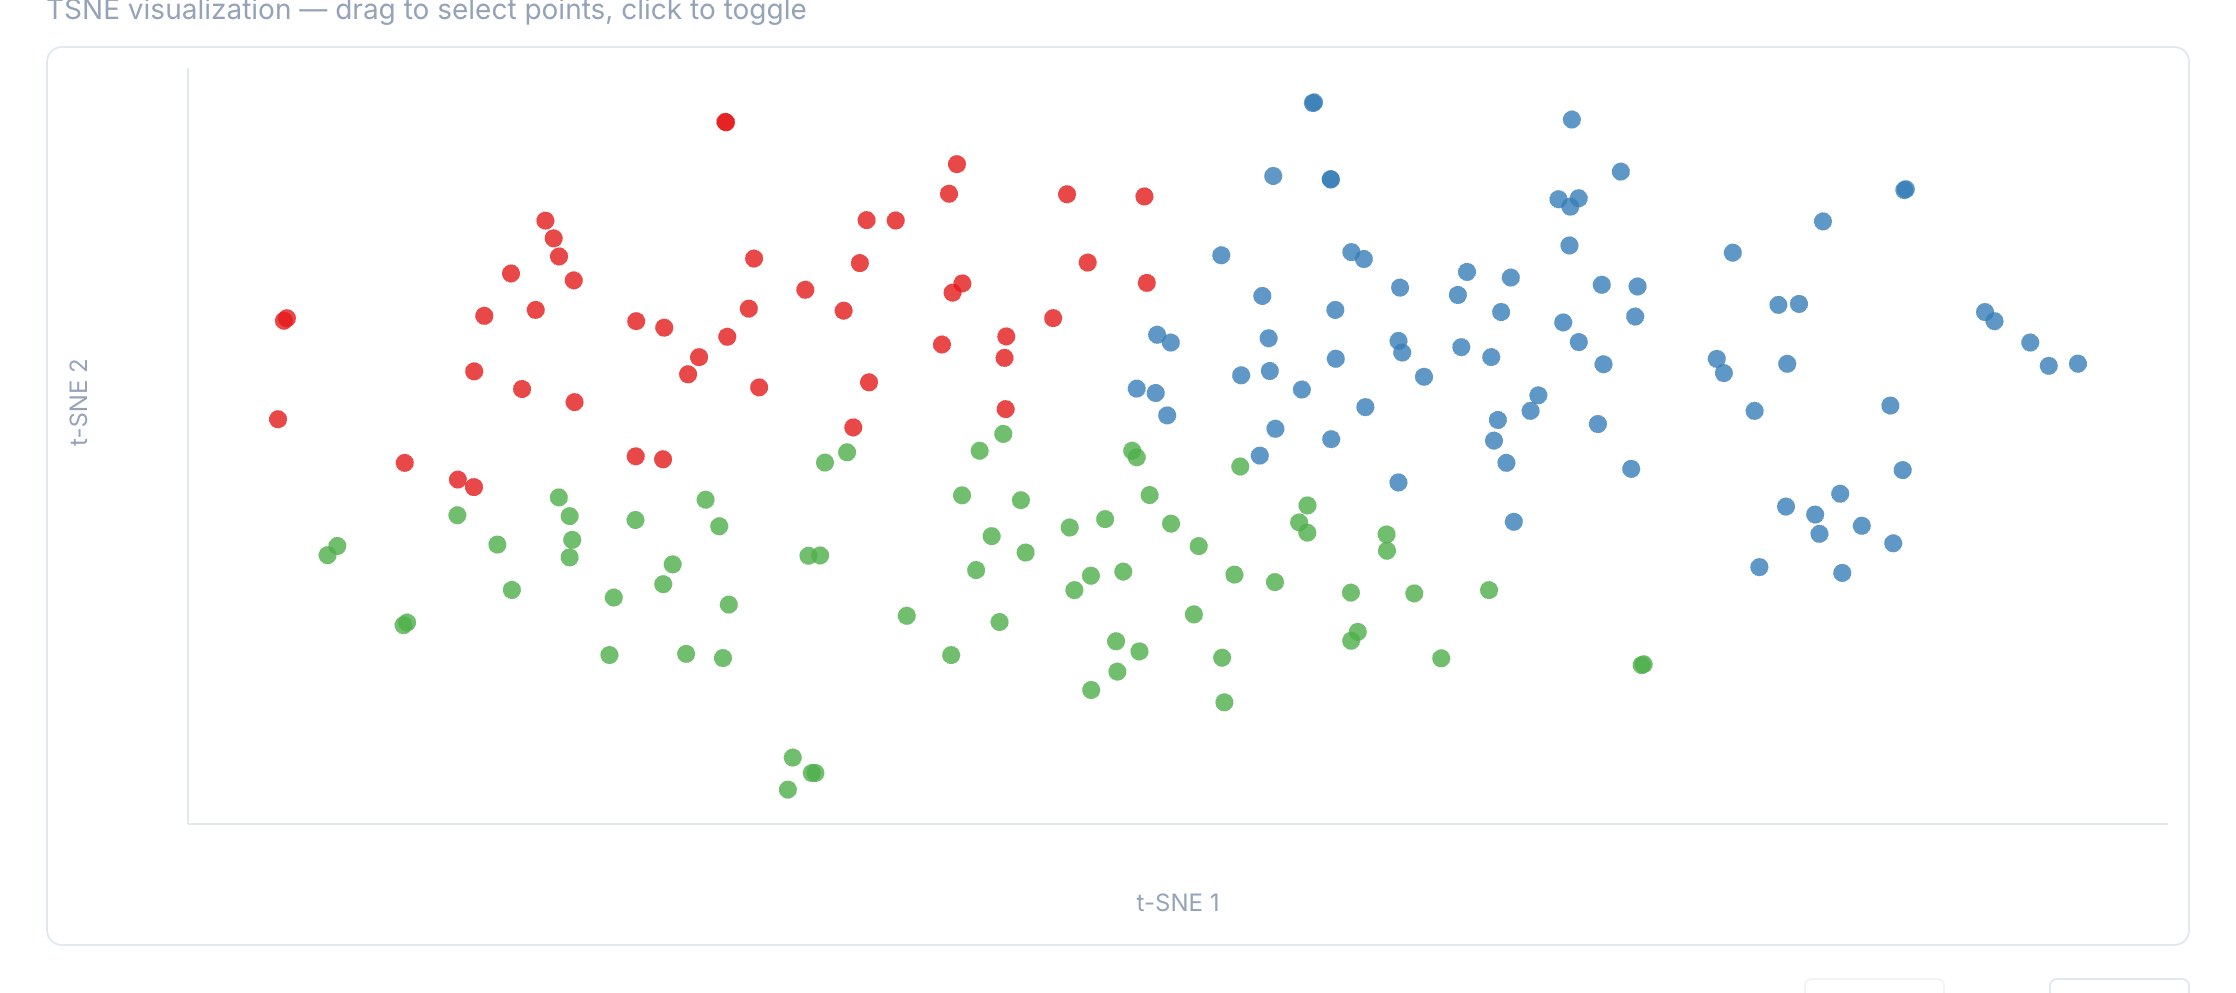
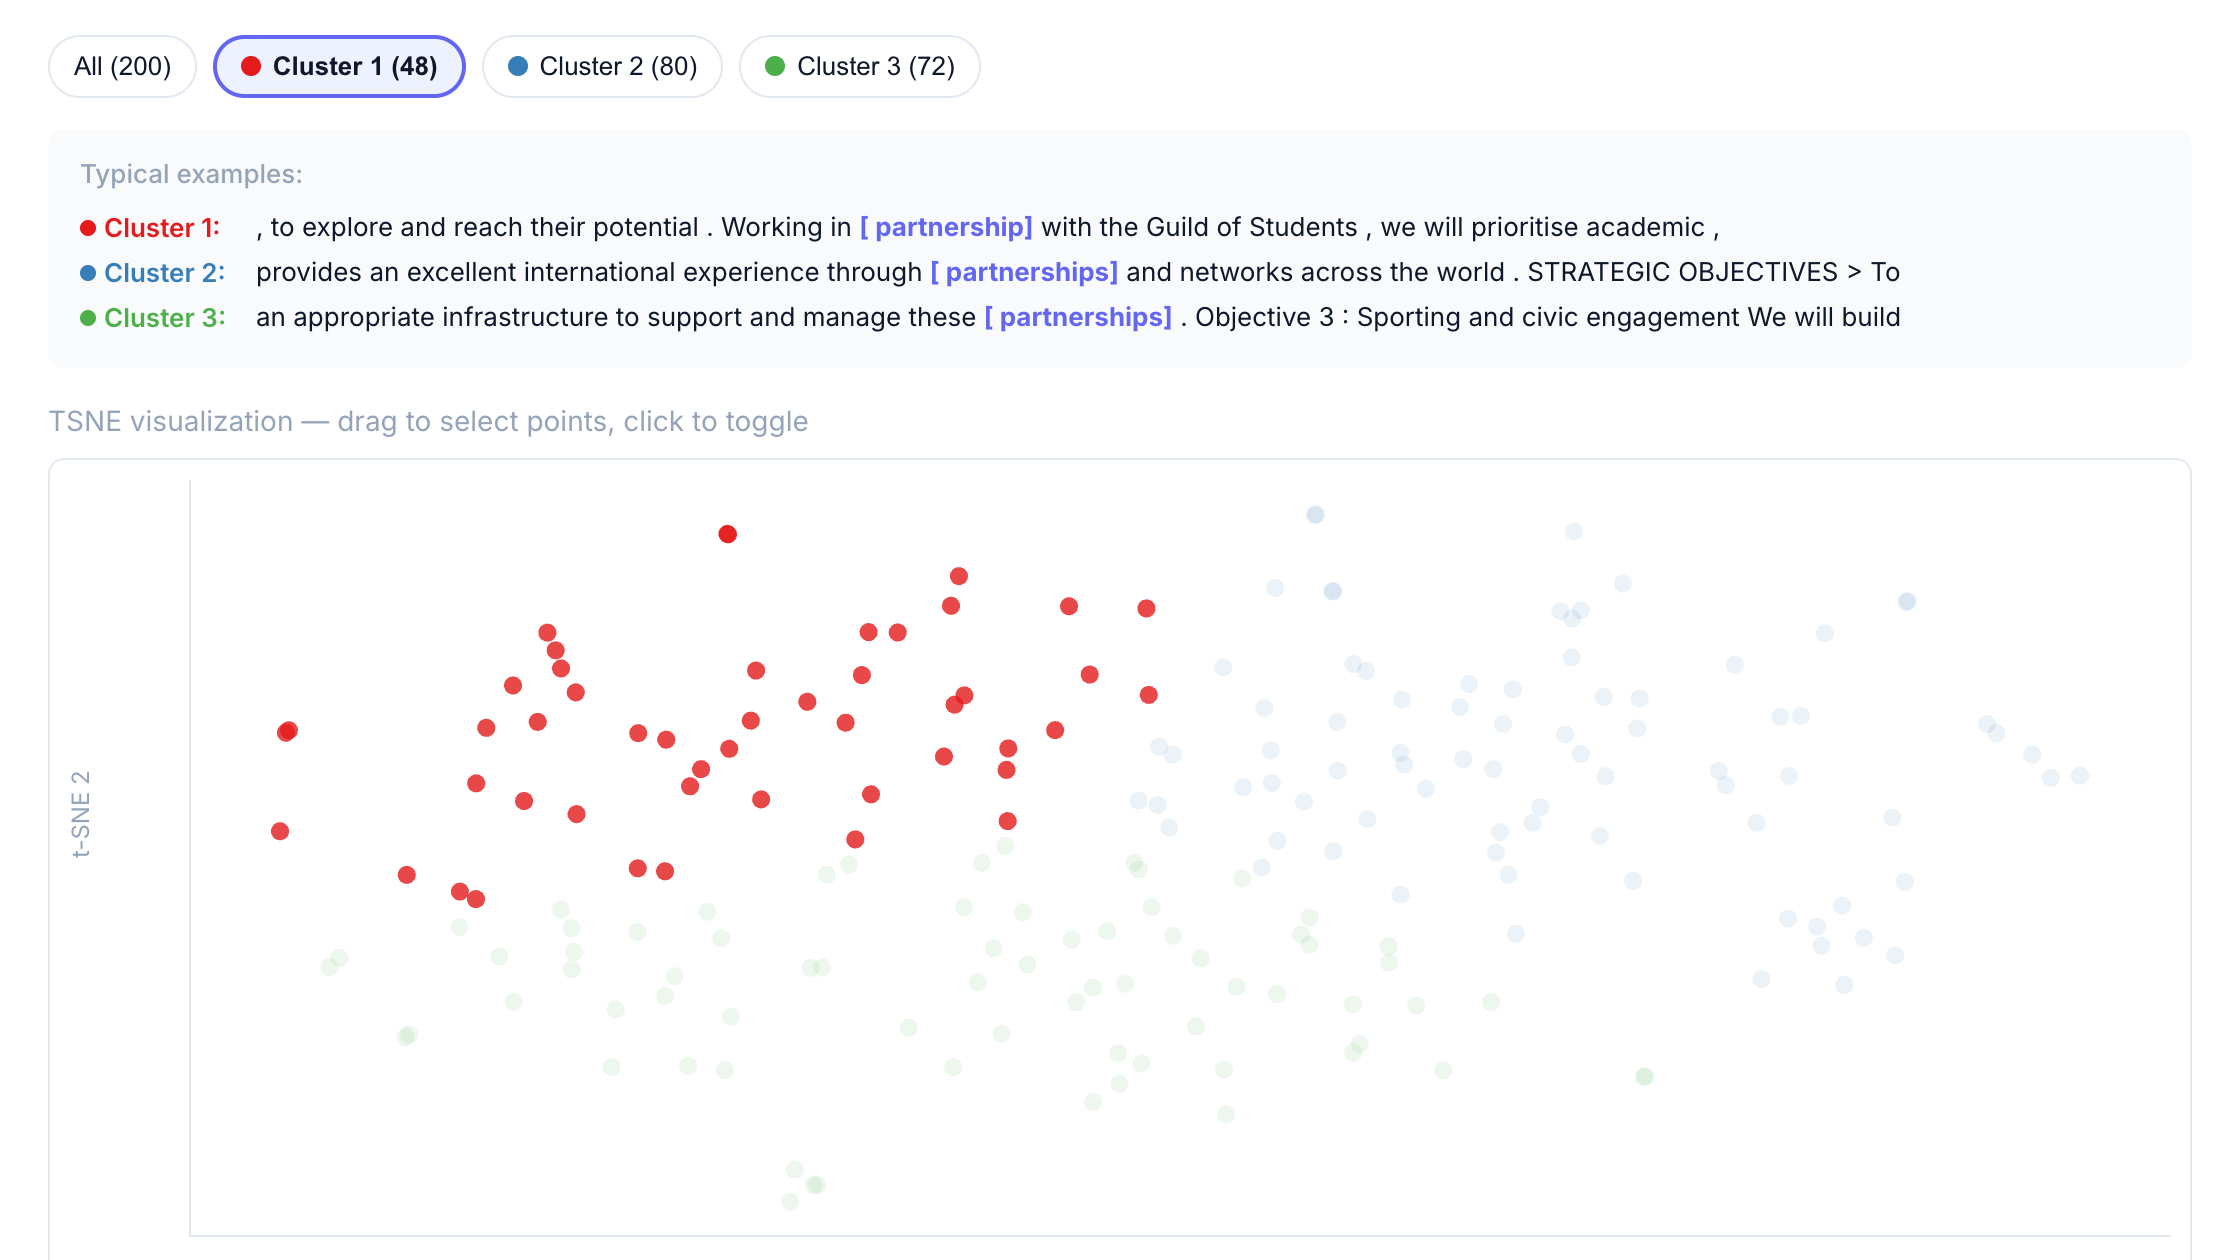
In this example, the analysis detected 3 clusters. The typical examples help interpret what distinguishes each cluster.
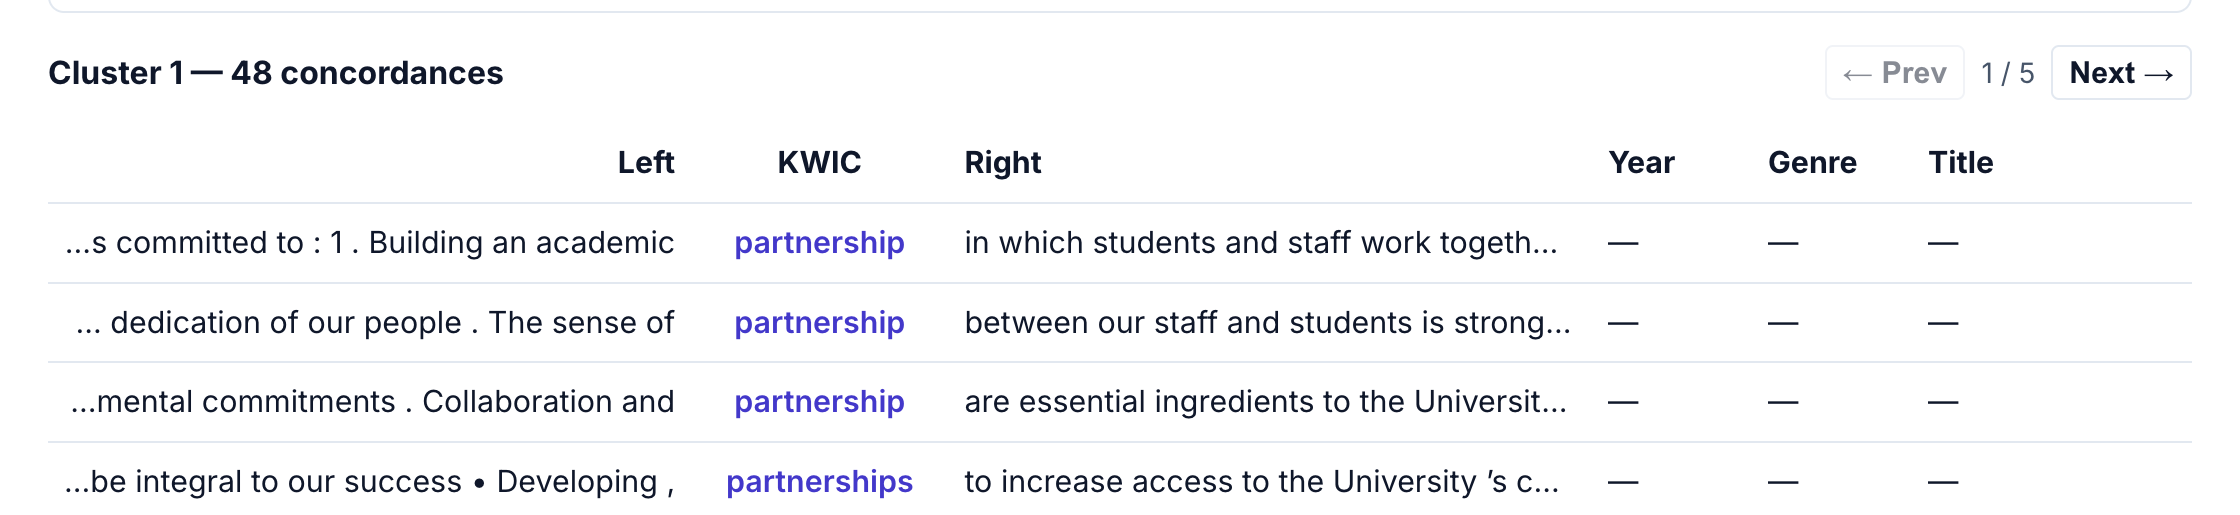
Step 4: Filter by cluster
Click a cluster button to filter the concordance table to only show lines from that cluster.
This makes it easy to:
- Read through examples from a specific semantic grouping
- Identify patterns in how “partnership” is used in different contexts
- Export filtered results for further analysis
Interpreting results
Semantic clusters represent usage similarity, not predefined categories. When interpreting:
- Look at the typical examples shown for each cluster
- Read several concordances from each cluster to understand the pattern
- Consider what linguistic or contextual features distinguish clusters
- Use the cluster slider to explore different numbers of clusters
For “partnership” in UniPlans, the clusters separate common usage patterns such as:
- Local/regional partnerships: community stakeholders, regional employers, local councils
- Global/international partnerships: worldwide networks, international collaborations, alumni connections
- Institutional partnerships: academic collaborations, internal initiatives, cross-campus programs